实验环境
- torch = 1.6.0
- torchvision = 0.7.0
- matplotlib = 3.3.3 # 绘图用
- progressbar = 2.5 # 绘制进度条用
- easydict # 超参数字典功能增强
使用数据集
导入相关的包
# 导包
import torch
import torch.nn as nn
import torch.optim as optim
from torch.utils.data import  DataLoader

import torchvision
from torchvision import datasets,transforms

import matplotlib.pyplot as plt
import random
from progressbar import *
设置超参数
from easydict import EasyDict #增强python的dict的功能用
# 定义超参数
super_param = {
    "batch_size":256,
    "device": torch.device('cuda:0' if torch.cuda.is_available() else 'cpu'),
    "epochs":10,
    "lr":0.3,
}
super_param = EasyDict(super_param)
print(super_param)
{'batch_size': 16, 'device': device(type='cuda', index=0), 'epochs': 10, 'lr': 0.3, 'hidden_num': 15}
数据处理(下载、处理、加载数据到DataLoader)
# 下载、加载数据

# 构transform(pipeline),对图像做处理
transform = transforms.Compose([
    transforms.ToTensor(),
    transforms.Normalize((0.1307,),(0.3081,)) #正则化
])

# 下载数据
trainsets = datasets.MNIST('data',train=True,download=True,transform=transform)
testsets = datasets.MNIST('data',train=False,download=True,transform=transform)

# dataloader 加载数据
train_loader = DataLoader(trainsets,batch_size=super_param.batch_size,shuffle=True)
test_loader = DataLoader(trainsets,batch_size=super_param.batch_size,shuffle=True)
查看数据样例
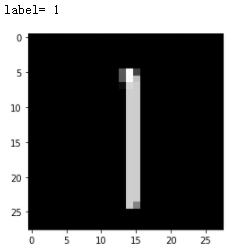
查看数据样例【单张】
# 查看数据样例-单张
image,label = trainsets[random.randint(0,len(trainsets))]
print('label=',label)
plt.imshow(image.permute(1,2,0),cmap='gray')
plt.show()

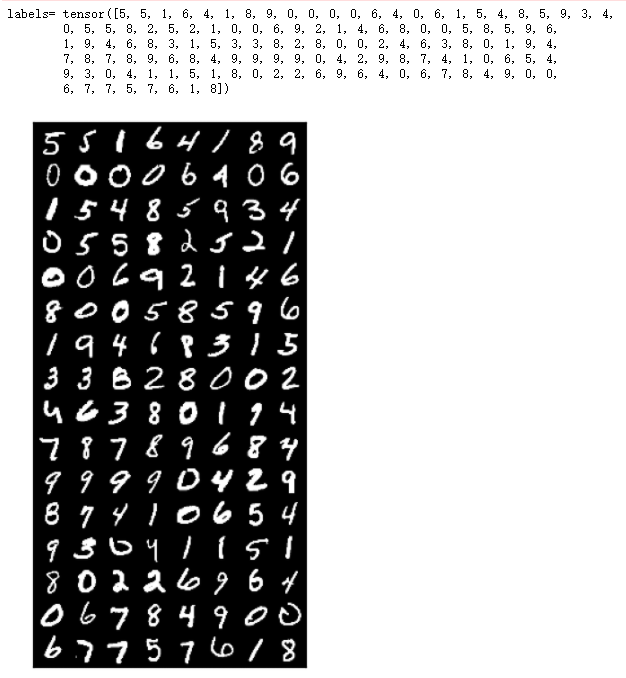
查看数据样例【一批】
# 查看数据样例-一批
images,labels = next(iter(test_loader))
data_sample_img = torchvision.utils.make_grid(images).numpy().transpose(1,2,0)
print('labels=',labels)
plt.figure(dpi=200)
plt.xticks([])
plt.yticks([])
plt.imshow(data_sample_img)
plt.show()

构建CNN网络模型 -简单版- 使用Sequential
## 构建CNN模型-简单版-使用Sequential
model = nn.Sequential(
    nn.Conv2d(in_channels=1,out_channels=10,kernel_size=5,stride=1,padding=0),# b*1*28*28-->b*10*24*24
    nn.ReLU(),
    nn.MaxPool2d(2),# b*10*24*24-->b*10*12*12
    nn.Conv2d(10,20,3,1,0),# b*10*12*12-->b*20*10*10
    nn.ReLU(),
    nn.Flatten(),#b*20*10*10-->b*2000
    nn.Linear(2000,500),#b*2000-->b*500
    nn.ReLU(),
    nn.Linear(500,10),#b*500-->b*10
    nn.ReLU(),
    nn.Softmax(),
)
print(model)
Sequential(
  (0): Conv2d(1, 10, kernel_size=(5, 5), stride=(1, 1))
  (1): ReLU()
  (2): MaxPool2d(kernel_size=2, stride=2, padding=0, dilation=1, ceil_mode=False)
  (3): Conv2d(10, 20, kernel_size=(3, 3), stride=(1, 1))
  (4): ReLU()
  (5): Flatten(start_dim=1, end_dim=-1)
  (6): Linear(in_features=2000, out_features=500, bias=True)
  (7): ReLU()
  (8): Linear(in_features=500, out_features=10, bias=True)
  (9): ReLU()
  (10): Softmax(dim=None)
)
构建CNN网络模型 -使用自定义类
# 构建网络模型 - 使用自定义类
class Digit_Rec(nn.Module):
    def __init__(self):
        super(Digit_Rec,self).__init__()
        self.conv1 = nn.Conv2d(1,10,5) #1:灰度图片的通道,10:输出通道,5:kernel
        self.relu1 = nn.ReLU()
        self.max_pool = nn.MaxPool2d(2,2)
        self.conv2 = nn.Conv2d(10,20,3) #10:输入通道,20:输出通道,3:Kernel
        self.relu2 = nn.ReLU()
        self.fc1 = nn.Linear(20*10*10,500) # 20*10*10:输入通道,500:输出通道
        self.relu3 = nn.ReLU()
        self.fc2 = nn.Linear(500,10) # 500:输入通道,10:输出通道
        self.relu4 = nn.ReLU()
        self.softmax = nn.Softmax(dim=1)
    def forward(self,x):
        batch_size = x.size(0) # x的格式:batch_size x 1 x 28 x 28 拿到了batch_size

        x = self.conv1(x) # 输入:batch*1*28*28   输出:batch*10*24*24
        x = self.relu1(x)

        x = self.max_pool(x) # 输入:batch*10*24*24输出:batch*10*12*12

        x = self.conv2(x)
        x = self.relu2(x)

        x = x.view(batch_size,-1) #fatten 展平 -1自动计算维度,20*10*10=2000

        x = self.fc1(x) # 输入:batch*2000  输出:batch*500
        x = self.relu3(x)

        x = self.fc2(x) # 输入:batch*500  输出:batch*10
        x = self.relu4(x)

        output = self.softmax(x) # 计算分类后,每个数字的概率值

        return output

model =  Digit_Rec()

print(model)
Digit_Rec(
  (conv1): Conv2d(1, 10, kernel_size=(5, 5), stride=(1, 1))
  (relu1): ReLU()
  (max_pool): MaxPool2d(kernel_size=2, stride=2, padding=0, dilation=1, ceil_mode=False)
  (conv2): Conv2d(10, 20, kernel_size=(3, 3), stride=(1, 1))
  (relu2): ReLU()
  (fc1): Linear(in_features=2000, out_features=500, bias=True)
  (relu3): ReLU()
  (fc2): Linear(in_features=500, out_features=10, bias=True)
  (relu4): ReLU()
  (softmax): Softmax(dim=1)
)
定义损失函数和优化器
# 定义损失函数和优化
criterion = nn.CrossEntropyLoss()
optimizer = torch.optim.SGD(model.parameters(),lr=super_param.lr)
定义模型训练单个epoch函数
# 定义模型训练单个epoch函数
def train_model_epoch(model,train_loader,super_param,criterion,optimzer,epoch):
    model.train()#训练声明

    for batch_index,(images,labels) in enumerate(train_loader):
        # 数据上device
        images,labels = images.to(super_param.device),labels.to(super_param.device)
        # 梯度清零
        optimzer.zero_grad()
        # 前向传播
        output = model(images)
        # 计算损失
        loss = criterion(output,labels)
        # 反向传播,计算梯度
        loss.backward()
        # 参数更新(优化)
        optimzer.step()

        # 打印训练参考信息,每1000个batch打印一次
        if batch_index % 1000 == 0:
            print("Epoch:{}    Batch Index(batch_size={}):{}/{}   Loss:{}".
                  format(epoch,super_param.batch_size,batch_index,len(train_loader),loss.item()))
定义模型验证方法
# 定义模型验证方法
def test_model(model,test_loader,super_param,criterion):
    model.eval()#测试声明

    # 数据统计
    correct_num,test_loss = 0.0,0.0 #正确数,测试损失

    #定义进度条
    widgets = ['模型测试中: ',Percentage(), ' ', Bar('#'),' ', Timer(),' ', ETA()]
    pbar = ProgressBar(widgets=widgets, maxval=100).start()

    # 取消计算梯度,避免更新模型参数
    with torch.no_grad():
        for batch_index,(images,labels) in enumerate(test_loader):
            # 数据上devics
            images,labels = images.to(super_param.device),labels.to(super_param.device)
            # 模型预测
            output = model(images)
            # 计算测试损失
            test_loss += criterion(output,labels).item()
            # 确定预测结果是哪个数字
            pred = output.argmax(dim=1) #argmax返回 值,索引 dim=1表示要索引
            # 统计预测正确数量
            correct_num += pred.eq(labels.view_as(pred)).sum().item()
            #更新进度条进度
            pbar.update(batch_index/len(test_loader)*100)

    #释放进度条
    pbar.finish()

    #打印测试信息
    test_loss = test_loss/len(test_loader.dataset)
    test_accuracy = correct_num / len(test_loader.dataset)
    print("Test --- Avg Loss:{},Accuracy:{}\n".format(test_loss,test_accuracy))

    return test_loss,test_accuracy
模型训练和测试
# 模型训练和测试

#模型上device
mode = model.to(super_param.device)

#记录每个epoch的测试数据、用于绘图
epoch_list = []
loss_list = []
accuracy_list = []

for epoch in range(super_param.epochs):
    train_model_epoch(model,train_loader,super_param,criterion,optimizer,epoch)
    test_loss,test_accuracy = test_model(model,test_loader,super_param,criterion)


    # 数据统计
    epoch_list.append(epoch)
    loss_list.append(test_loss)
    accuracy_list.append(test_accuracy)
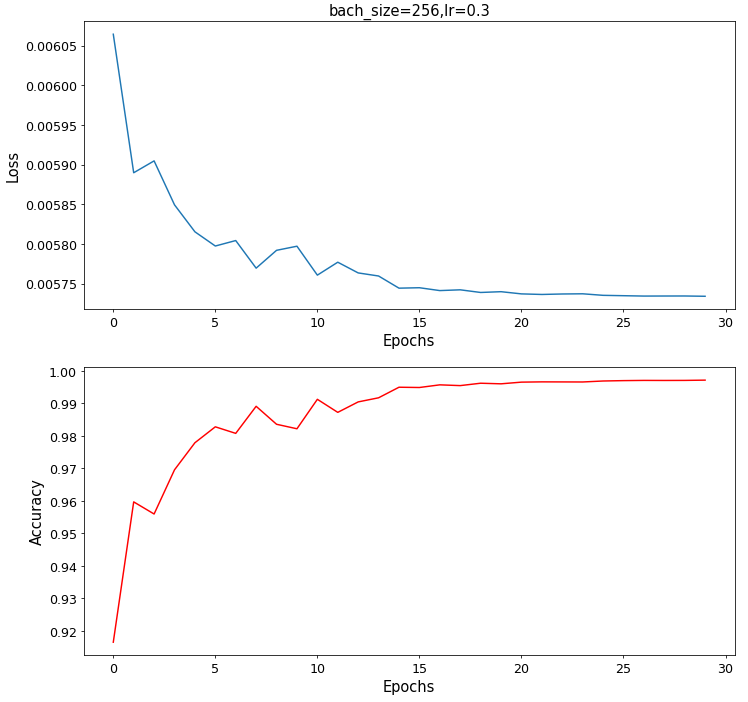
查看数据统计结果
# 查看数据统计结果

fig = plt.figure(figsize=(12,12),dpi=70)

#子图1
ax1 = plt.subplot(2,1,1)
title = "bach_size={},lr={}".format(super_param.batch_size,super_param.lr)
plt.title(title,fontsize=15)
plt.xlabel('Epochs',fontsize=15)
plt.ylabel('Loss',fontsize=15)
plt.xticks(fontsize=13)
plt.yticks(fontsize=13)
plt.plot(epoch_list,loss_list)


#子图2
ax2 = plt.subplot(2,1,2)
plt.xlabel('Epochs',fontsize=15)
plt.ylabel('Accuracy',fontsize=15)
plt.xticks(fontsize=13)
plt.yticks(fontsize=13)
plt.plot(epoch_list,accuracy_list,'r')

plt.show()


测试
非常不错