1.核心函数
# 目标检测效果可视化

import numpy as np
import cv2

# class_list
class_list = ['Plane', 'BridgeVehicle', 'Person', 'LuggageVehicle', 'RefuelVehicle', 'FoodVehicle', 'LuggageVehicleHead', 'TractorVehicle', 'RubbishVehicle', 'FollowMe']

"""
生成color_list
"""
# 生成number个color
def random_color(color_num):
    color_list = []

    for j in range(color_num):
        color_single = (int(np.random.randint(0,255)),int(np.random.randint(0,255)),int(np.random.randint(0,255)))
        color_list.append(tuple(color_single))
    return color_list
color_list = random_color(len(class_list))

"""
目标检测预测结果可视化函数
    + img:进行目标检测的图片
    + bbox_list:处理过的预测结果
    + class_name_list:用于将cls_is转为cls_name
    + color_list:绘制不同的类别使用不同的颜色
    + thresh:阈值
"""
def vis_detections(img, bbox_list,class_name_list=class_list,color_list=color_list,thresh=0.5):
    for bbox in bbox_list:
        # 参数解析
        x1,y1,x2,y2,score,cls_id = bbox[0],bbox[1],bbox[2], bbox[3],bbox[4],int(bbox[5])
        cls_name = class_name_list[cls_id]
        color = color_list[cls_id]

        # 跳过低于阈值的框
        if score<thresh:continue

        # 画框
        cv2.rectangle(img, (int(x1),int(y1)), (int(x2),int(y2)),color_list[cls_id],2)

        # 画label
        label_text = '{:s} {:.3f}'.format(cls_name, score)
        cv2.putText(img, label_text, (x1-5, y1-5),cv2.FONT_HERSHEY_SIMPLEX, 0.8, color_list[cls_id], 2)
    return img
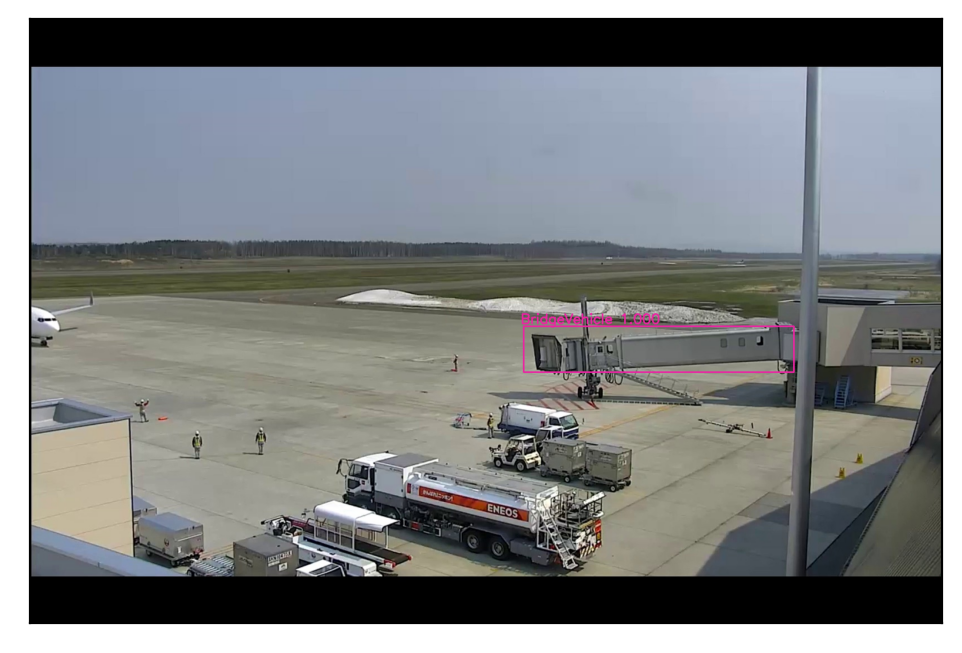
2.调用测试
img = cv2.imread("./data_handle/img/00001.jpg.")

bbox_list = [
    [882,549,1365,631,1,1]
]

img = vis_detections(img,bbox_list)
img_show = cv2.cvtColor(img,cv2.COLOR_BGR2RGB)

import matplotlib.pyplot as plt

plt.figure(dpi=200)
plt.xticks([])
plt.yticks([])
plt.imshow(img_show)
plt.show()


评论 (0)