


1.K-means算法
- 具体介绍参考:Kmeans算法简介
k-means聚类的算法运行过程:
(1)选择k个初始聚类中心
(2)计算每个对象与这k个中心各自的距离,按照最小距离原则分配到最邻近聚类
(3)使用每个聚类中的样本均值作为新的聚类中心
(4)重复步骤(2)和(3)直到聚类中心不再变化
(5)结束,得到k个聚类
2.算法实现
2.1数据加载
- 函数封装
# STEP1:加载数据集,获取所有box的width、height
import os
from progressbar import *
import xmltodict
import numpy as np


def load_dataset(data_root):
    xml_dir= os.path.join(data_root,"Annotations")  #xml文件路径(Annotations)
    width_height_list = [] #用于存储统计结果

    #进度条功能
    widgets = ['box width_height 统计: ',Percentage(), ' ', Bar('#'),' ', Timer(),' ', ETA()]
    pbar = ProgressBar(widgets=widgets, maxval=len(os.listdir(xml_dir))).start()
    count = 0

    for xml_file in os.listdir(xml_dir):
        # 拼接xml文件的path
        xml_file_path = os.path.join(xml_dir,xml_file)

        # 读取xml文件到字符串
        with open(xml_file_path) as f:
            xml_str = f.read()

        # xml字符串转为字典
        xml_dic = xmltodict.parse(xml_str)

        # 获取图片的width、height
        img_width = float(xml_dic["annotation"]["size"]["width"])
        img_height = float(xml_dic["annotation"]["size"]["height"])

        # 获取xml文件中的所有objects
        obj_list = []
        objects = xml_dic["annotation"]["object"]
        if isinstance(objects,list): # xml文件中包含多个object
            for obj in objects:
                obj_list.append(obj)
        else: # xml文件中包含1个object
            obj_list.append(objects)
        #print(obj_list)

        # width_height布统计
        for obj in obj_list:
            #box 的height\width归一化
            box_width = (float(obj['bndbox']["xmax"]) - float(obj['bndbox']["xmin"]))/img_width
            box_height = (float(obj['bndbox']["ymax"]) - float(obj['bndbox']["ymin"]))/img_height

            width_height_list.append([box_width,box_height])

        #更新进度条
        count += 1
        pbar.update(count)

    #释放进度条
pbar.finish()- 调用效果
#输出统计结果信息
data_root = "/data/jupiter/project/dataset/209_VOC_new"

width_height_list = load_dataset(data_root)
width_height_np = np.array(width_height_list)
print("clustering feature data is ready. shape = (N object, width and height) =  {}".format(width_height_np.shape))
box width_height 统计: 100% |###############| Elapsed Time: 0:00:35 Time: 0:00:35
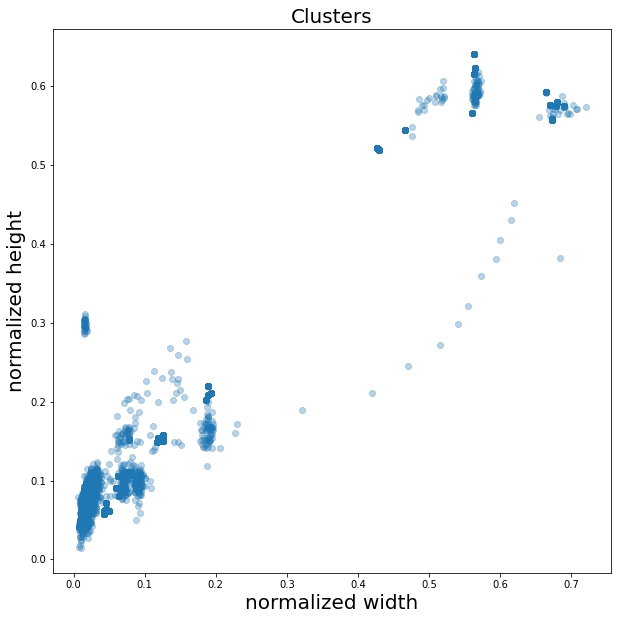
clustering feature data is ready. shape = (N object, width and height) = (10670, 2)2.2 将未聚类前的统计结果绘图表示
# 将未聚类前的统计结果绘图表示
import matplotlib.pyplot as plt

plt.figure(figsize=(10,10))
plt.scatter(width_height_np[:,0],width_height_np[:,1],alpha=0.3)
plt.title("Clusters",fontsize=20)
plt.xlabel("normalized width",fontsize=20)
plt.ylabel("normalized height",fontsize=20)
plt.show()- 调用效果
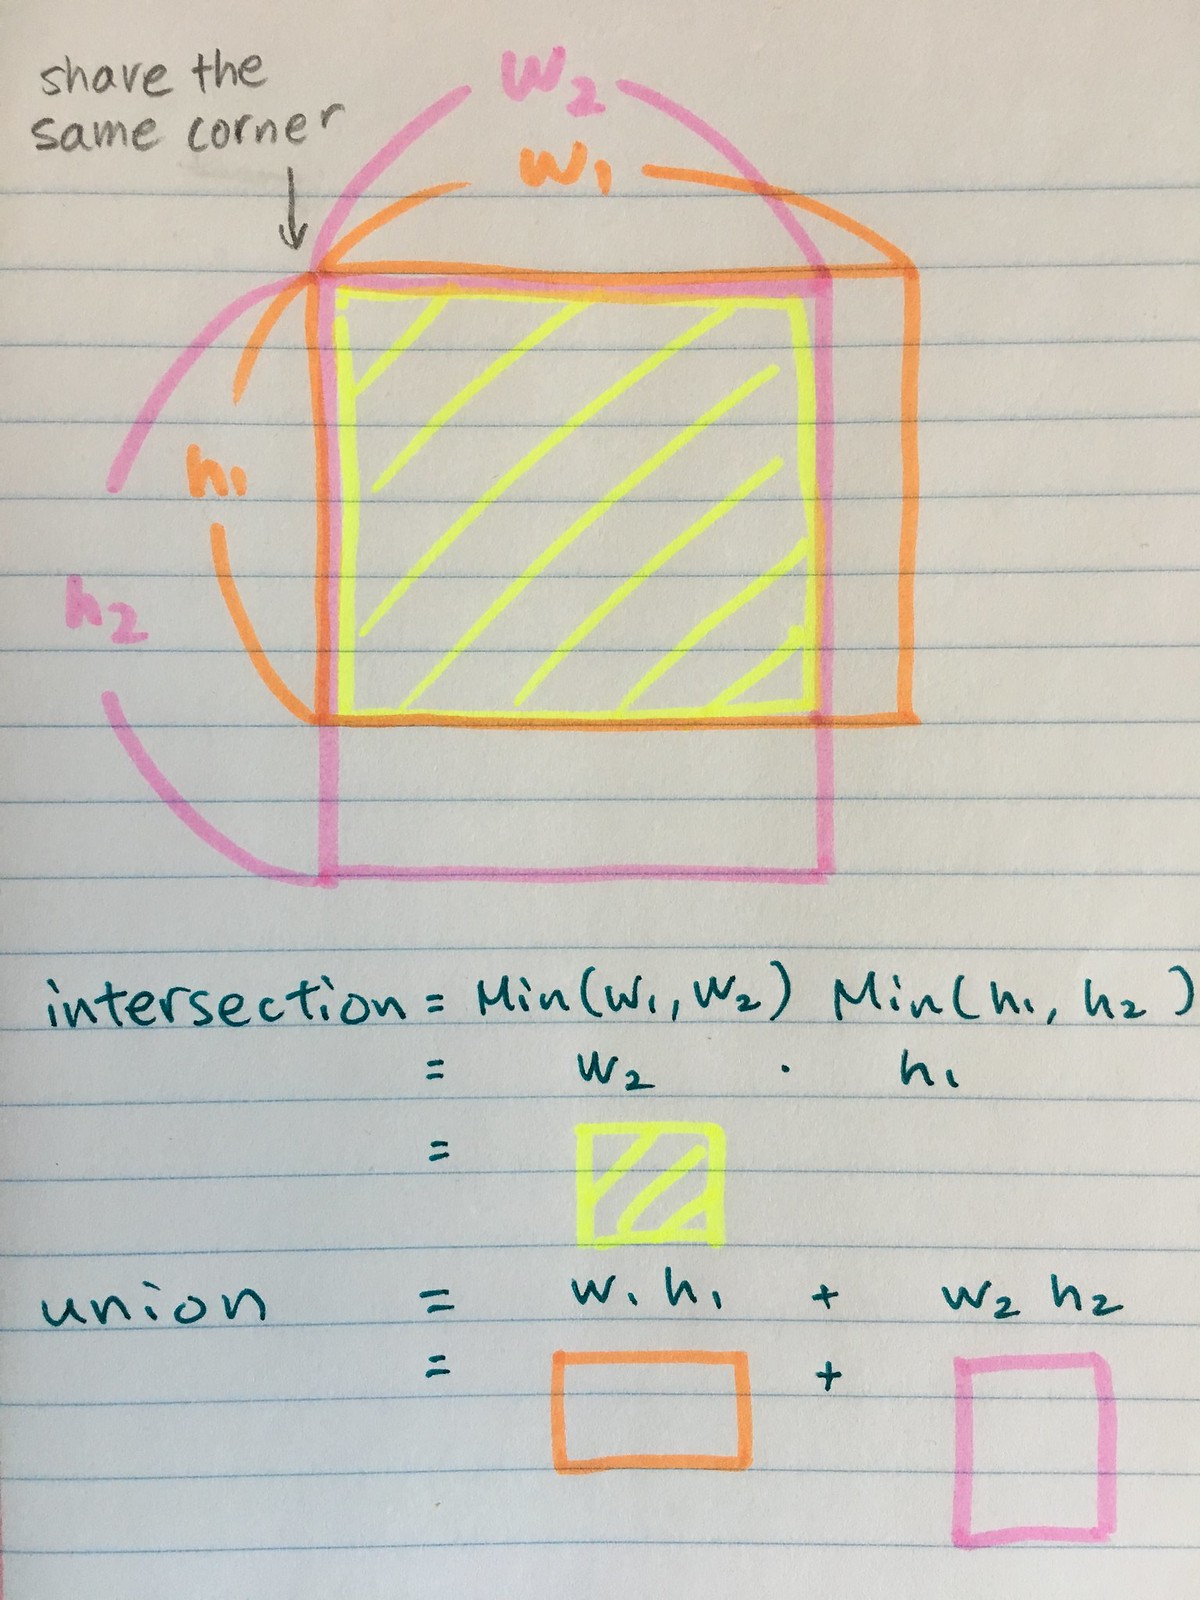
2.3 实现距离评估函数(这里用的是iou)
这里iou的计算公式为:
$$ \begin{array}{rl} IoU &= \frac{\textrm{intersection} }{ \textrm{union} - \textrm{intersection} }\\ \textrm{intersection} &= Min(w_1,w_2) Min(h_1,h_2)\\ \textrm{union} & = w_1 h_1 + w_2 h_2 \end{array} $$
- 图示
- 代码实现
import numpy as np

# 数据间距离评估函数
def iou(box, clusters):
    """
    计算一个ground truth边界盒和k个先验框(Anchor)的交并比(IOU)值。
    参数box: 元组或者数据,代表ground truth的长宽。
    参数clusters: 形如(k,2)的numpy数组,其中k是聚类Anchor框的个数
    返回:ground truth和每个Anchor框的交并比。
    """
    x = np.minimum(clusters[:, 0], box[0])
    y = np.minimum(clusters[:, 1], box[1])
    if np.count_nonzero(x == 0) > 0 or np.count_nonzero(y == 0) > 0:
        raise ValueError("Box has no area")
    intersection = x * y
    box_area = box[0] * box[1]
    cluster_area = clusters[:, 0] * clusters[:, 1]
    iou_ = intersection / (box_area + cluster_area - intersection)
    return iou_
2.4实现kmeans聚类函数
# 实现kmeans聚类函数
def kmeans(boxes, k):
    """
    利用IOU值进行K-means聚类
    参数boxes: 形状为(r, 2)的ground truth框,其中r是ground truth的个数
    参数k: Anchor的个数
    返回值:形状为(k, 2)的k个Anchor框
    """
    # 即是上面提到的r
    rows = boxes.shape[0]
    # 距离数组,计算每个ground truth和k个Anchor的距离
    distances = np.empty((rows, k))
    # 上一次每个ground truth"距离"最近的Anchor索引
    last_clusters = np.zeros((rows,))
    # 设置随机数种子
    np.random.seed()

    # 初始化聚类中心,k个簇,从r个ground truth随机选k个
    clusters = boxes[np.random.choice(rows, k, replace=False)]
    # 开始聚类
    while True:
        # 计算每个ground truth和k个Anchor的距离,用1-IOU(box,anchor)来计算
        for row in range(rows):
            distances[row] = 1 - iou(boxes[row], clusters)
        # 对每个ground truth,选取距离最小的那个Anchor,并存下索引
        nearest_clusters = np.argmin(distances, axis=1)
        # 如果当前每个ground truth"距离"最近的Anchor索引和上一次一样,聚类结束
        if (last_clusters == nearest_clusters).all():
            break
        # 更新簇中心为簇里面所有的ground truth框的均值
        for cluster in range(k):
            clusters[cluster] = np.median(boxes[nearest_clusters == cluster], axis=0)
        # 更新每个ground truth"距离"最近的Anchor索引
        last_clusters = nearest_clusters

    return clusters,nearest_clusters
2.4 调用测试
CLUSTERS = 9 #聚类数量,anchor数量
INPUTDIM = 416 #输入网络大小

clusters_center_list,nearest_clusters = kmeans(width_height_np, k=CLUSTERS)
clusters_center_list_handle = np.array(clusters_center_list)*INPUTDIM

# 得到最终填入YOLOv3 的cfg文件中的anchor
print('Boxes:')
print(clusters_center_list_handle.astype(np.int32))
Boxes:
[[ 9 37]
[235 239]
[ 4 30]
[ 24 33]
[ 5 21]
[ 52 63]
[ 5 26]
[ 7 28]
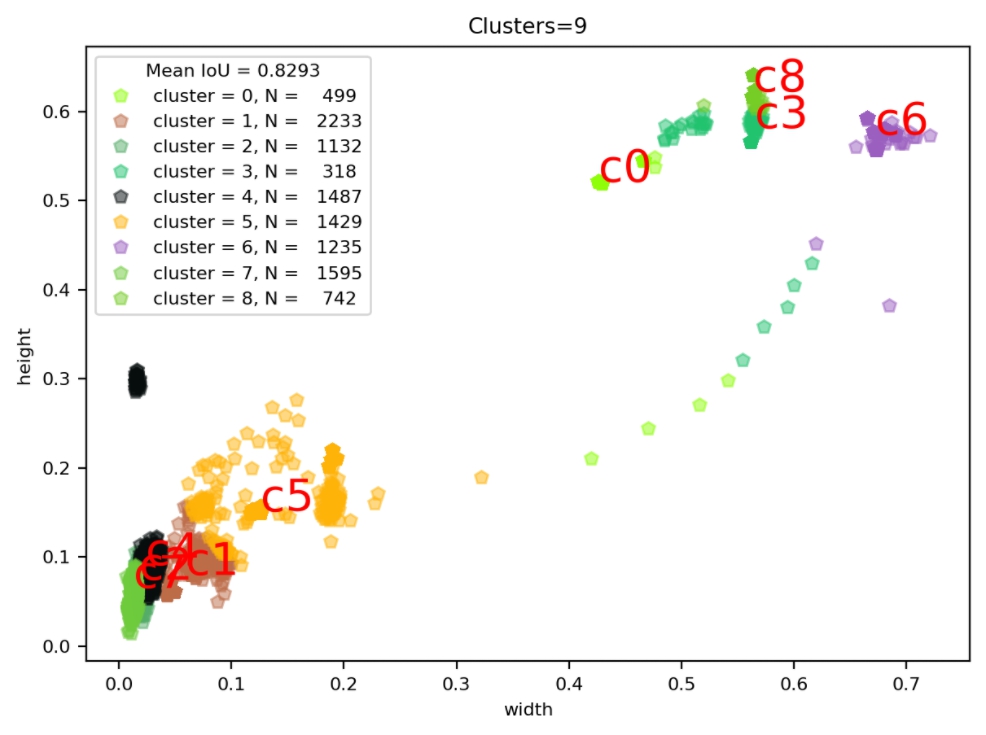
[ 6 33]]2.5聚类结果绘制与效果评估(mean_iou)
- 查看数据聚类结果
import seaborn as sns
current_palette = list(sns.xkcd_rgb.values())
def plot_cluster_result(plt,clusters,nearest_clusters,mean_iou,width_height_np,k):
    for icluster in np.unique(nearest_clusters):
        pick = nearest_clusters==icluster
        c = current_palette[icluster]
        plt.rc('font', size=8)
        plt.plot(width_height_np[pick,0],width_height_np[pick,1],"p",
                 color=c,
                 alpha=0.5,label="cluster = {}, N = {:6.0f}".format(icluster,np.sum(pick)))
        plt.text(clusters[icluster,0],
                 clusters[icluster,1],
                 "c{}".format(icluster),
                 fontsize=20,color="red")
        plt.title("Clusters=%d" %k)
        plt.xlabel("width")
        plt.ylabel("height")
    plt.legend(title="Mean IoU = {:5.4f}".format(mean_iou))


# achor结果评估
def avg_iou(boxes, clusters):
    """
    计算一个ground truth和k个Anchor的交并比的均值。
    """
    return np.mean([np.max(iou(boxes[i], clusters)) for i in range(boxes.shape[0])])

figsize = (7,5)
plt.figure(figsize=figsize)

mean_iou = avg_iou(width_height_np, out)
plot_cluster_result(plt,clusters_center_list,nearest_clusters,mean_iou,width_height_np,k=CLUSTERS)- 运行效果
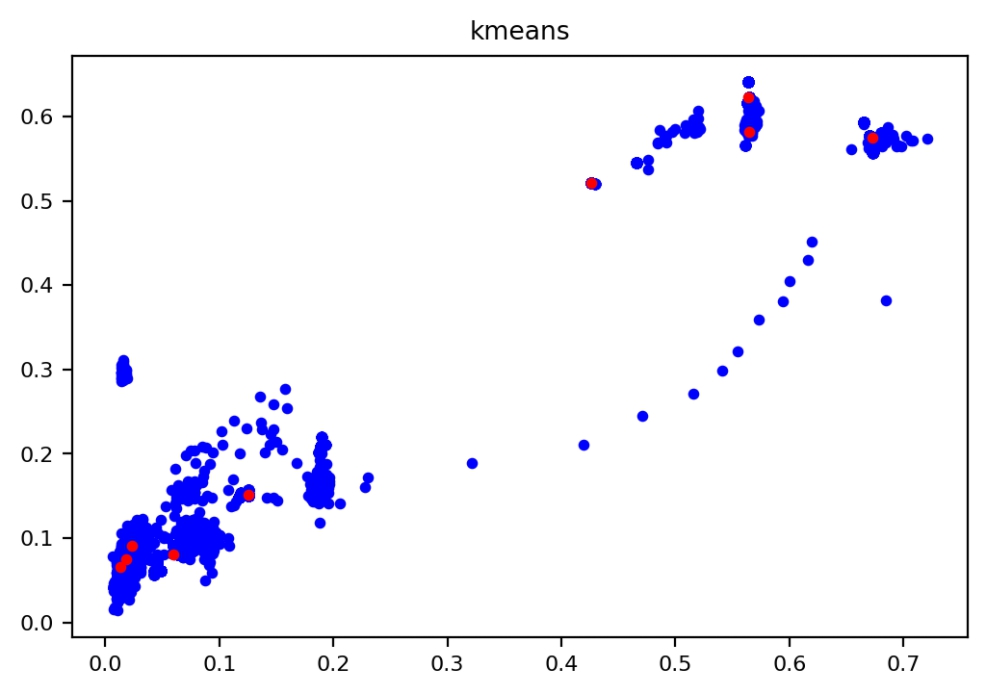
- 查看聚类中心分布
w = width_height_np[:, 0].tolist()
h = width_height_np[:, 1].tolist()
centroid_w=clusters_center_list[:,0].tolist()
centroid_h=clusters_center_list[:,1].tolist()

plt.figure(dpi=200)
plt.title("kmeans")
plt.scatter(w, h, s=10, color='b')
plt.scatter(centroid_w,centroid_h,s=10,color='r')
plt.show()- 运行效果
3.汇总简略版
#coding=utf-8
import xml.etree.ElementTree as ET
import numpy as np
import glob


def iou(box, clusters):
    """
    计算一个ground truth边界盒和k个先验框(Anchor)的交并比(IOU)值。
    参数box: 元组或者数据,代表ground truth的长宽。
    参数clusters: 形如(k,2)的numpy数组,其中k是聚类Anchor框的个数
    返回:ground truth和每个Anchor框的交并比。
    """
    x = np.minimum(clusters[:, 0], box[0])
    y = np.minimum(clusters[:, 1], box[1])
    if np.count_nonzero(x == 0) > 0 or np.count_nonzero(y == 0) > 0:
        raise ValueError("Box has no area")
    intersection = x * y
    box_area = box[0] * box[1]
    cluster_area = clusters[:, 0] * clusters[:, 1]
    iou_ = intersection / (box_area + cluster_area - intersection)
    return iou_


def avg_iou(boxes, clusters):
    """
    计算一个ground truth和k个Anchor的交并比的均值。
    """
    return np.mean([np.max(iou(boxes[i], clusters)) for i in range(boxes.shape[0])])

def kmeans(boxes, k):
    """
    利用IOU值进行K-means聚类
    参数boxes: 形状为(r, 2)的ground truth框,其中r是ground truth的个数
    参数k: Anchor的个数
    参数dist: 距离函数
    返回值:形状为(k, 2)的k个Anchor框
    """
    # 即是上面提到的r
    rows = boxes.shape[0]
    # 距离数组,计算每个ground truth和k个Anchor的距离
    distances = np.empty((rows, k))
    # 上一次每个ground truth"距离"最近的Anchor索引
    last_clusters = np.zeros((rows,))
    # 设置随机数种子
    np.random.seed()

    # 初始化聚类中心,k个簇,从r个ground truth随机选k个
    clusters = boxes[np.random.choice(rows, k, replace=False)]
    # 开始聚类
    while True:
        # 计算每个ground truth和k个Anchor的距离,用1-IOU(box,anchor)来计算
        for row in range(rows):
            distances[row] = 1 - iou(boxes[row], clusters)
        # 对每个ground truth,选取距离最小的那个Anchor,并存下索引
        nearest_clusters = np.argmin(distances, axis=1)
        # 如果当前每个ground truth"距离"最近的Anchor索引和上一次一样,聚类结束
        if (last_clusters == nearest_clusters).all():
            break
        # 更新簇中心为簇里面所有的ground truth框的均值
        for cluster in range(k):
            clusters[cluster] = np.median(boxes[nearest_clusters == cluster], axis=0)
        # 更新每个ground truth"距离"最近的Anchor索引
        last_clusters = nearest_clusters

    return clusters

# 加载自己的数据集,只需要所有labelimg标注出来的xml文件即可
def load_dataset(path):
    dataset = []
    for xml_file in glob.glob("{}/*xml".format(path)):
        tree = ET.parse(xml_file)
        # 图片高度
        height = int(tree.findtext("./size/height"))
        # 图片宽度
        width = int(tree.findtext("./size/width"))

        for obj in tree.iter("object"):
            # 偏移量
            xmin = int(obj.findtext("bndbox/xmin")) / width
            ymin = int(obj.findtext("bndbox/ymin")) / height
            xmax = int(obj.findtext("bndbox/xmax")) / width
            ymax = int(obj.findtext("bndbox/ymax")) / height
            xmin = np.float64(xmin)
            ymin = np.float64(ymin)
            xmax = np.float64(xmax)
            ymax = np.float64(ymax)
            if xmax == xmin or ymax == ymin:
                print(xml_file)
            # 将Anchor的长宽放入dateset,运行kmeans获得Anchor
            dataset.append([xmax - xmin, ymax - ymin])
    return np.array(dataset)


ANNOTATIONS_PATH = "/data/jupiter/project/dataset/209_VOC_new/Annotations" #xml文件所在文件夹
CLUSTERS = 9 #聚类数量,anchor数量
INPUTDIM = 416 #输入网络大小

data = load_dataset(ANNOTATIONS_PATH)
out = kmeans(data, k=CLUSTERS)
print('Boxes:')
out_handle = np.array(out)*INPUTDIM
print(out_handle.astype(np.int32))
print("Accuracy: {:.2f}%".format(avg_iou(data, out) * 100))
final_anchors = np.around(out[:, 0] / out[:, 1], decimals=2).tolist()
print("Before Sort Ratios:\n {}".format(final_anchors))
print("After Sort Ratios:\n {}".format(sorted(final_anchors)))
Boxes:
[[ 8 34]
[234 256]
[279 239]
[ 52 63]
[ 6 28]
[ 5 26]
[ 24 33]
[ 10 37]
[177 216]]
Accuracy: 82.93%
Before Sort Ratios:
[0.24, 0.92, 1.17, 0.83, 0.23, 0.19, 0.74, 0.28, 0.82]
After Sort Ratios:
[0.19, 0.23, 0.24, 0.28, 0.74, 0.82, 0.83, 0.92, 1.17]
评论 (0)